


Beyond Kanner and Asperger – Part 4

Doctor Coplan continues his discussion of his revolutionary way of looking at ASD.
Beyond Kanner and Asperger – Part 4
In this post I will begin to address items 3 and 4 on my list of basic principles:
-
General Intelligence (IQ) is a separate property from atypicality.
-
Atypicality of any degree can co-exist with any level of general intelligence.
The definition of autism is silent on the subject of intelligence. On the one hand, this is as it should be; ASD is defined by impaired social skills, impaired pragmatics and prosody (communication and speech inflection), repetitive thoughts and behaviors, and unusual sensorimotor traits, not impaired intelligence. On the other hand, long-term outcome for a child with ASD has everything to do with intelligence. Numerous follow-up studies (reviewed in Appendix II of my book have reinforced the truth of Bartak and Rutter’s initial observation.[1]
Philosophers and psychologists have argued for thousands of years over how to define and measure “intelligence.” It would be nice if we could sidestep that question, and say that we will use IQ, as measured by a standardized test of intelligence, as our benchmark. However, life is not that simple. The grand paradox of IQ testing is that the instruments themselves have been developed and refined based on normal subjects, but then they are used on persons with special needs – a population they were never designed to serve. If administered strictly “by the book,” this can be manifestly unfair for people who are highly skilled, but “differently-abled.” In fact, IQ testing of persons with special needs is an art form all its own. The examiner starts with the standard tools, but the means of administration and the choices of which items to include in the final score must be adapted to the situation. For example, persons with ASD typically have strong rote memory skills but limited social reasoning ability. The examiner needs to avoid “inflator scores” on IQ testing that simply tap rote memory. By the same token, the examiner may opt to exclude tasks that hinge on social reasoning (the “Comprehension” task on the WISC is a good example) from the final IQ score. (The same discrepancy plays itself out during academic achievement testing: the child with ASD may have superior decoding skills – the ability to convert the printed word to speech – but extremely weak reading comprehension. This pattern gets its own name: hyperlexia. Many children with ASD do relatively well academically in Kindergarten, 1st, and 2nd grade, cruising along on the strength of their strong rote memory. Their ships run aground in 3rd grade, when the academic curriculum shifts from rote memorization of basic facts, to tasks that require comprehension and inference.)
Most standardized tests of intelligence are designed to yield an average (“mean”) score of 100, and a Standard Deviation (SD) of 15 points. “Standard Deviation” is a measure of how bunched up or spread out the scores are, on either side of the mean (Figure 1). In an ideal sample, approximately 68% of individuals lie within 1 SD of the mean (34% will be 0 to 1 SD above, and 34% will be 0 to 1 SD below). Another 27% lie in the range of -1 to -2 SD or +1 to +2 SD (13.5% lie between -1 and -2; another 13.5% lie between +1 and +2), bringing the proportion of individuals who lie within 2 SD of the mean up to about 95% of the total. The remaining 5% are apportioned between the upper and lower “tails” of the curve: About 2.4% lie > 2 SD above the mean, and a corresponding 2.4% lie > 2 SD below the mean (the percentages don’t add up to exactly 100, because of rounding error, and in real life the curve is not perfectly symmetrical: the peak in the middle is flattened a bit, and there are more persons at the tails than predicted).
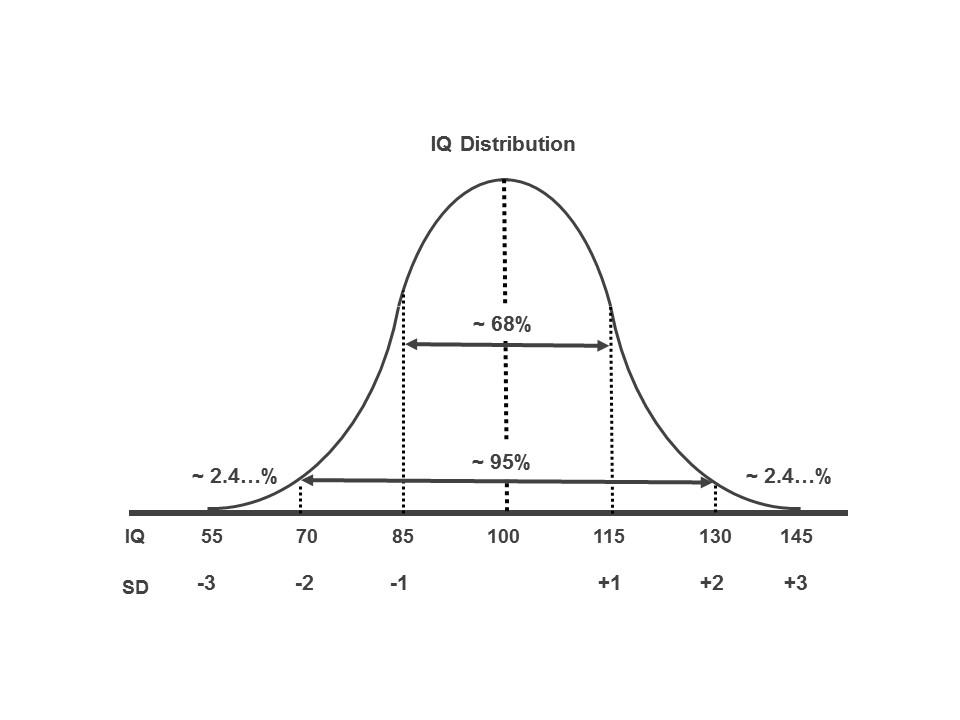
(Click to enlarge)
Figure 1. Relationship between IQ, Standard Deviation (SD), and the proportion of the population, in an ideal (“normally distributed”) sample. The little squiggle means “approximately equal to.” Percentages do not add up to 100 because of rounding errors. Roughly 95% of individuals lie within 2 standard deviations of the mean. The remaining 5% are apportioned between the upper and lower “tails” of the curve.
———————————————————————————
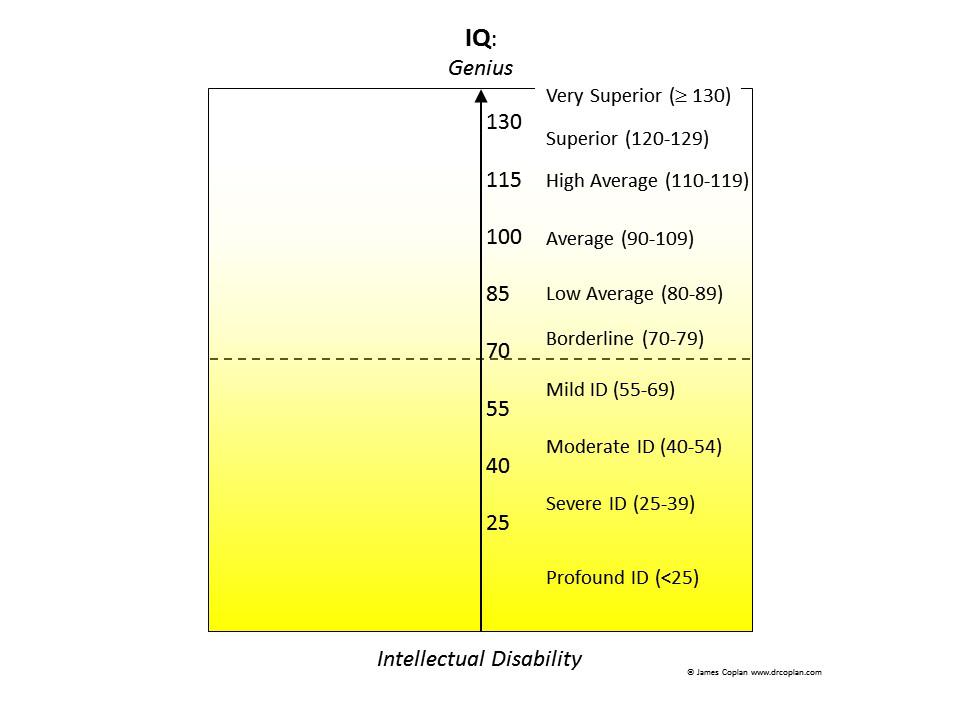
For my purposes, a more useful way to display the data is shown in Figure 2. Here, IQ is displayed on a vertical axis. The IQ ranges have been labelled according to common clinical usage (Average, Low Average, Borderline, etc.). I have also added yellow shading, to represent the presence and degree of intellectual limitation, from solid yellow for Intellectual Disability, fading to faint yellow for Borderline IQ (which used to be termed “Borderline Retarded”).
(Click to enlarge)
Figure 2. IQ ranges and their common names. Yellow shading corresponds to the presence and degree of intellectual impairment. Notice that “Average” IQ occupies a 20 point band (90-109), while most of the others are 10 to 15 points wide. ID, Intellectual Disability.
———————————————————————–
We know that any degree of atypicality can co-exist with any level of intelligence. (This is true even in the movies. Dustin Hoffman’s character in Rainman has severe atypicality and high IQ. Sean Penn’s character in I am Sam has moderate atypicality and borderline IQ. Alas, there are also a many individuals with ASD plus Intellectual Disability – although not in the movies). How do we incorporate this fact into our view of “the solar system” that is ASD?
Stay tuned.
James Coplan, MD is an Internationally recognized clinician, author, and public speaker in the fields of early child development, early language development and autistic spectrum disorders. Join Dr. Coplan on Facebook and Twitter. Have a question for Dr. Coplan? Ask the doctor.
1. Bartak, L. and M. Rutter, Differences between mentally retarded and normally intelligent autistic children. Journal of Autism & Childhood Schizophrenia, 1976. 6(2): p. 109-20.
Continue to Part Five.


Leave a Reply